What Do I Map?
A key to knowing HOW to map a business process is knowing WHAT to map.
Follow the documents...
If you want to understand the INFORMATION WORKFLOW -- not just who does
work and where work is done, but WHAT is done to WHAT documents and WHAT
systems, how documents (electronic and paper) work together, where
information is introduced, where it comes from and how it is used, then
you need the details. Here is how you document the details...
Map Real Things -- the 'Documents' that drive the process.
Many flowcharts are drawn to show a high-level conceptual flow of data through a few locations. They show a string of ambiguous Activity Boxes and Decision Diamonds. Box and arrow diagrams and swimlane diagrams are examples of high-level conceptual maps. They don't display the actual records that drive the process.What is a document?
A document is something physical. It is something you can see. An item is a form, an electronic file, an email, a document, a spreadsheet, a CD, a database, an application, a log sheet, a reference book, etc. We record, transmit and store information on documents. Documents convey the information that drives our processes. Documents are the foundation of a good busines flow chart.
When you follow the documents,
all information changes present themselves.
all information changes present themselves.

Documents give substance to a process flow chart. They enable us to assemble an otherwise nebulous
collection of activities into an organized, reality-based system. Each Document is charted
as a separate horizontal flow line that is identified at its beginning with a
label.
What documents are involved in the process?
No other process flow charting method addresses this basic question! How can you understand a process if you don't have a clear understanding of the documents that drive it?Labels
Each Document in a Graham Process Map is represented as its own horizontal line. Each line begins with a Label
Relationships between the documents are shown with Effects and Brackets.
Since no other methods display multiple document flows, they offer no way to see relationships between them.Effects
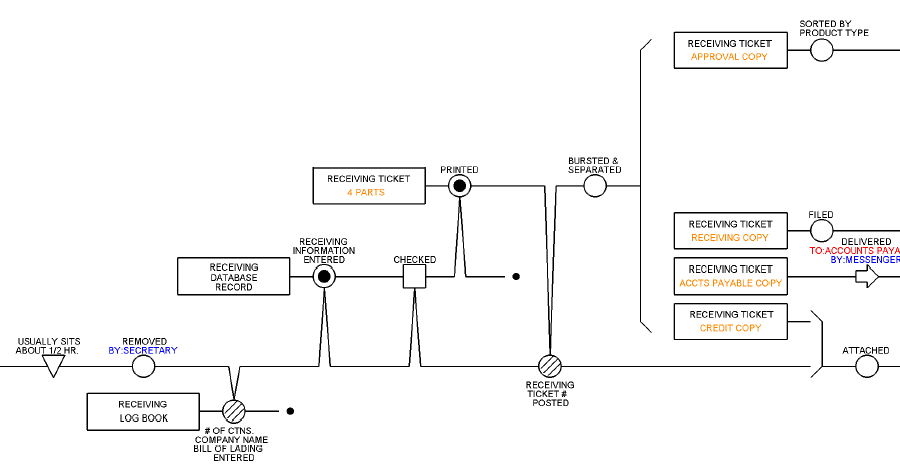
Effects are the Vee shapes in a process flow chart that point from one line (Source Document) into a symbol on another line (Target Document). The effect is a simple yet extremely powerful charting element -- it says that the activity that occurs at the point of the effect doesn't happen without the Source Document. In the illustration, the Shipping Papers that kick off this process provide the information that is entered in the Log Book and in the Receiving Database. The Shipping Papers are then used to check the entries made into the Receiving Database. The Receiving Database prints out the Receiving Ticket.
Brackets
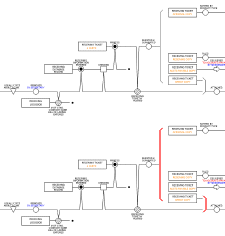
An Opening Bracket is used in a flow chart to show when Documents are separated. It is immediately followed by Labels that identify the Documents that have been separated. The 4-part Receiving Ticket is separated in this example. The separating step is followed immediately by an Opening Bracket containing four Labels that begin a separate flow line for each of the individual Receiving Ticket parts. This is a clear display of parallel processing.
A Closing Bracket is used in a flow chart to show when Documents are physically assembled. A Closing Bracket is shown near the lower right corner of the illustration where the Credit Copy of the Receiving Ticket is attached to the Shipping Papers.
Graham Process Maps show the details.
Questions or Comments - Call 800-628-9558 or
send us a note


