Where is the PROCESS TIME consumed?
Where is most of the time spent?
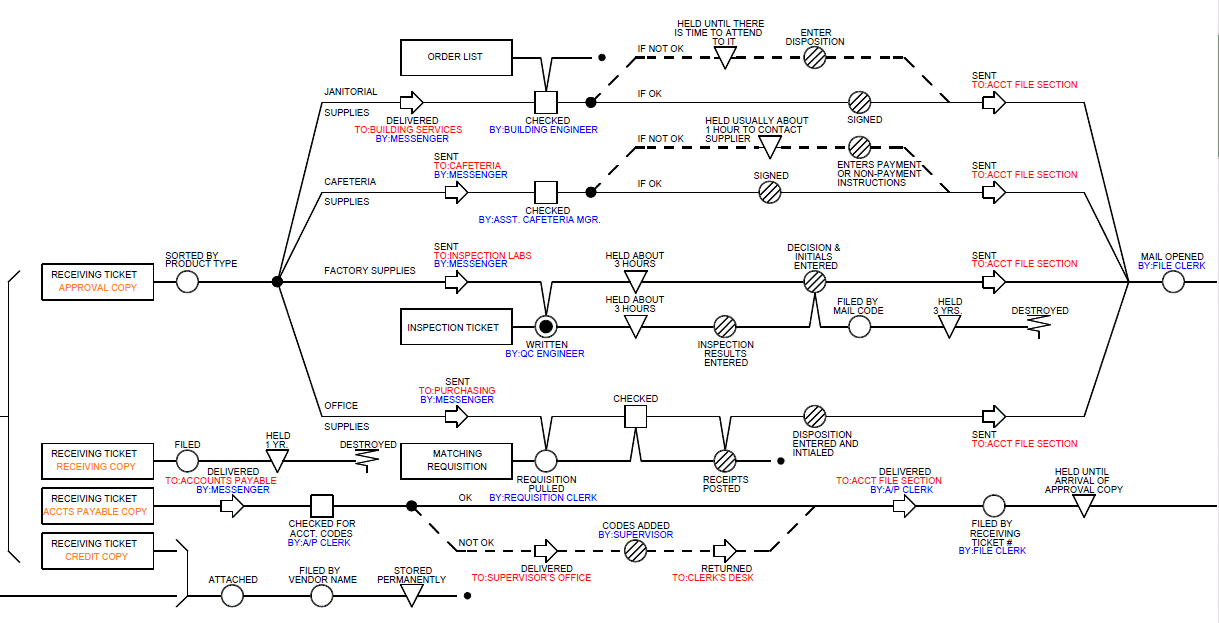
Most of the time in most processes is consumed by delays. Do your flow charts even show delays?...Most don't. Graham Process flow charts show delays for each item in the process as well as the time consumed by other activities. Times can be associated with every step and displayed wherever relevant, particularly with delays.
Time (When & How Long)
Storage and Delays are displayed in the flow chart with their own symbol -
Almost all of the processing time, and most OTHER process maps don't even show delays!
Graham Process Maps show the details.
Look for the delay symbols
 to find most
of the processing time. Of course, other steps may consume large amounts of time, but most of
the time is typically consumed by delays.
