Graham Process Mapping Software
Version 8 Highlights
We've come a long way since the release of version 1 in 1990! The method hasn't changed much: process maps created in 1990 and earlier (with templates) look alot like the maps we create today.
Pre-1990 - Templates
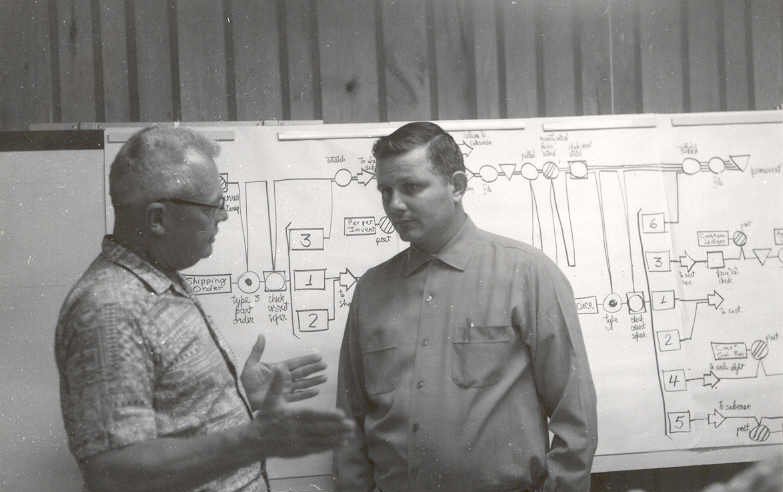
Alan Mogensen and Dr. Ben Graham, Jr.
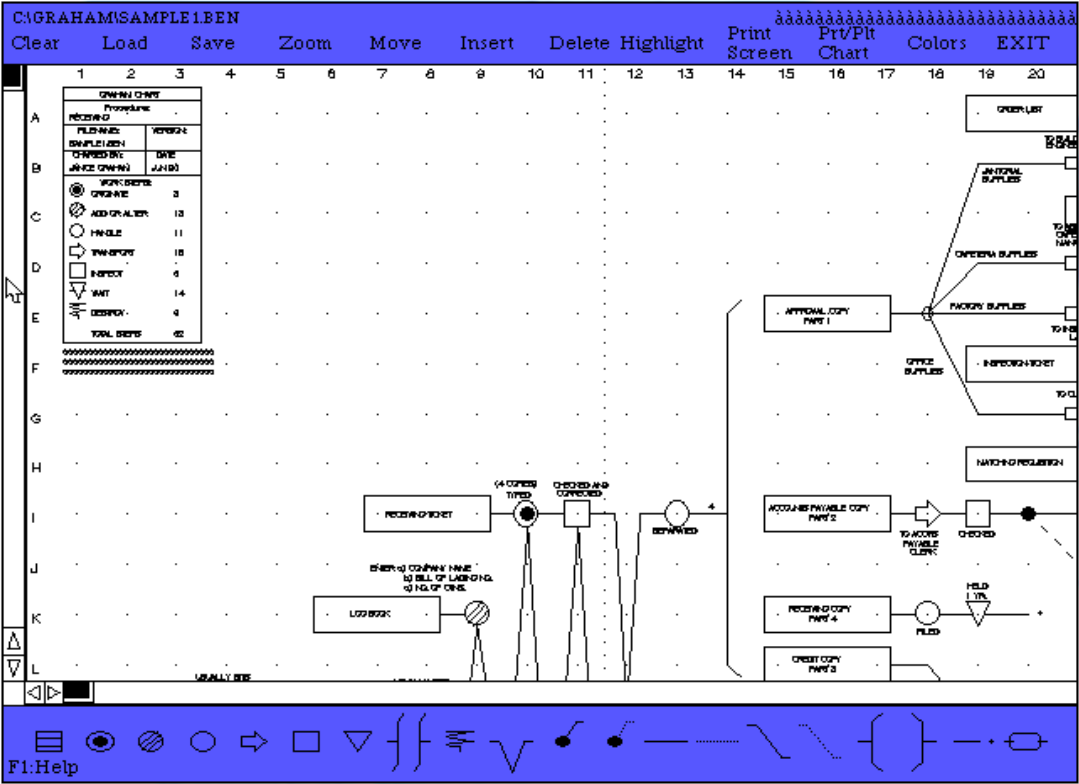
1990 - Version 1 DOS
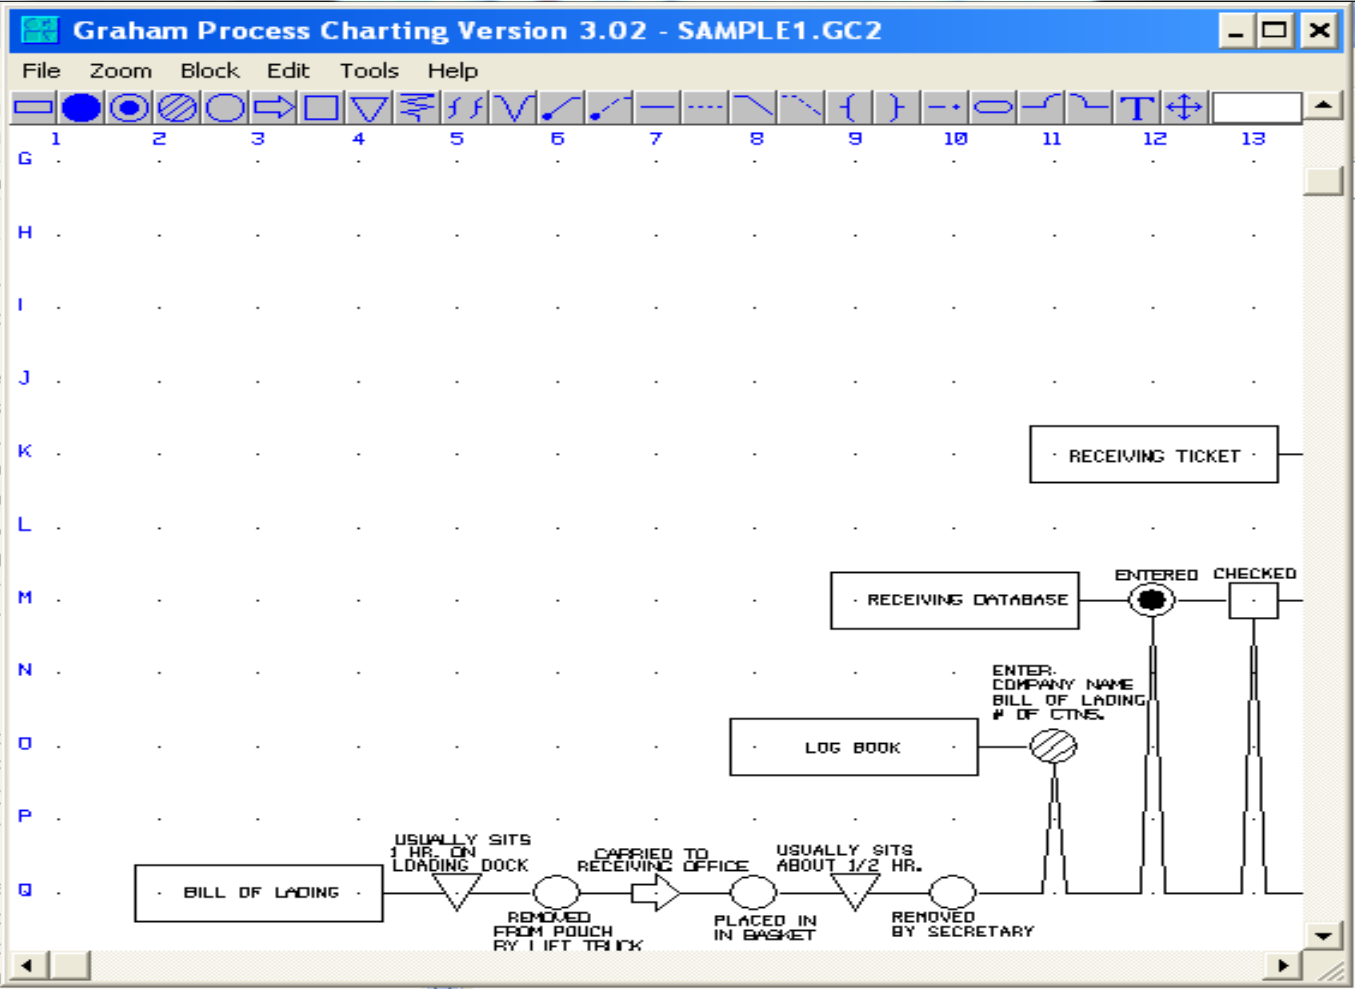
1995 - Version 3 Windows
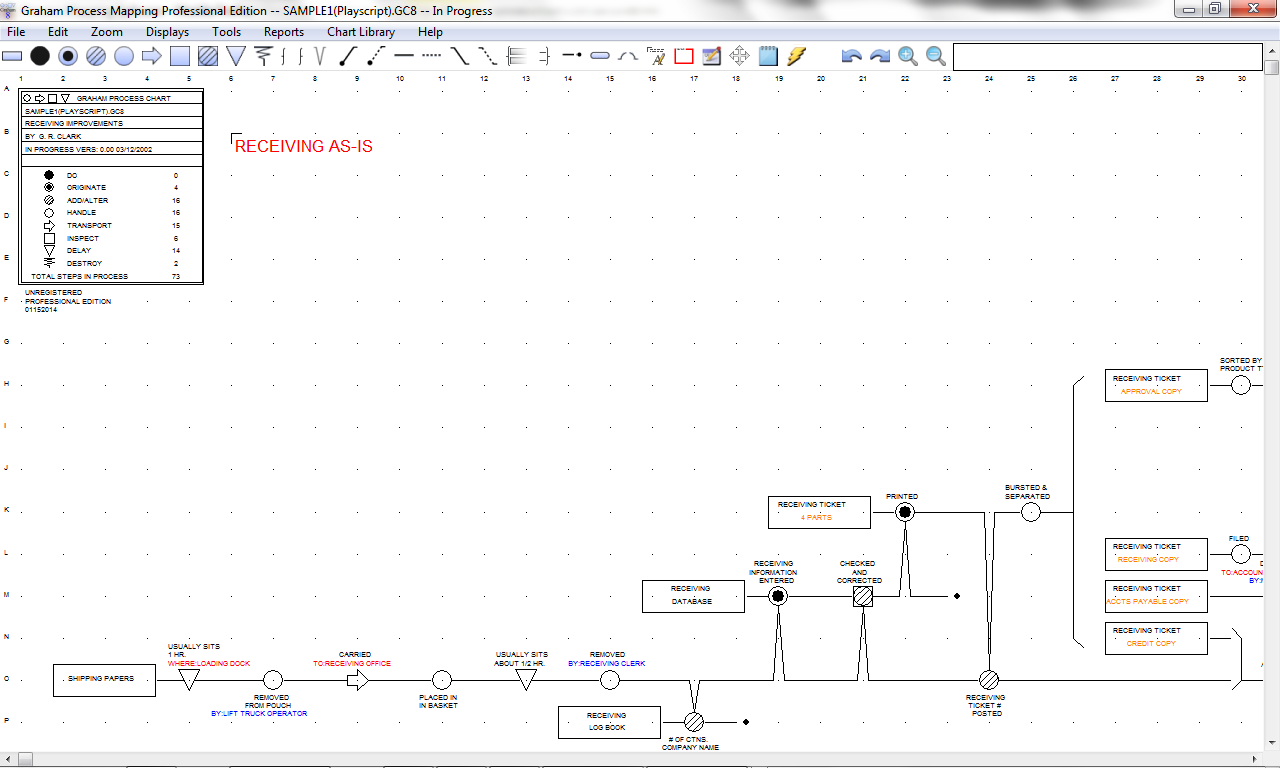
2014 Version 8
We have enabled the mouse scroll wheel functionality – It now moves the screen horizontal 20% of the width of the screen per wheel click. Hold the Ctrl Key while you scroll to move the screen vertically 2 grids per wheel click.
The (object) right click menu is set so an immediate left click launches the text edit window and right click menu options can be displayed or hidden via Preferences.
Charts look cleaner with a new screen font and we have added zoom buttons and undo/redo buttons to the toolbar. Also, the + and – keys can be used to Zoom in and out.
The find function remains at find location when closed.
You can save any Block that has been cut or copied as a Template (Ctrl-T or select from the Edit Menu). Template Blocks can be retrieved and reused any time (Ctrl-L for the list or select from the Edit Menu).
The chart size is displayed on the print window making it easy to set plotted chart lengths.
A warning window displays periodically (after a specified number of actions that can be set in the preferences) to remind you to save your work.
Playscript reporting is updated to include output to XML and faster and direct output to Word.
The best way to see what is in the software and what it does is to take it for a test run. Click the Test Drive button in the upper left corner of this page and check it out!