Test Drive

Buy Now!

Overview Maps

Graham Process Mapping Software


Overview Maps/Charts

Overview Charts are useful for focusing on a particular aspect of a process for presentation and for supporting detail-level analysis. They offer a different perspective, like adding color to a chart. An Overview Chart displays all the Item flows and their interrelationships, but does not show all the detail-level steps.

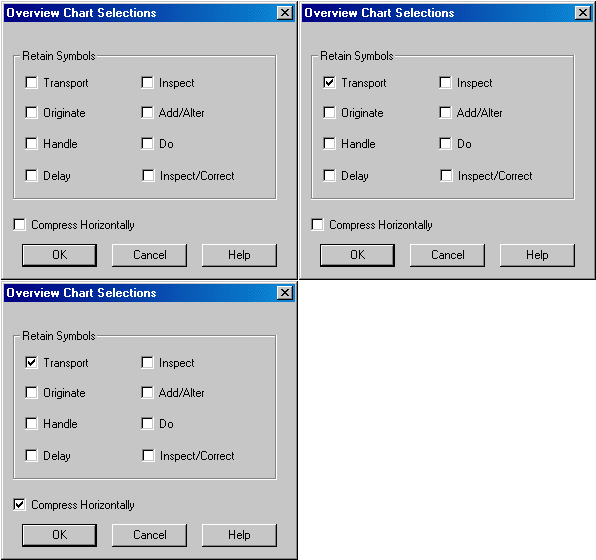
You can select any of the symbols that you want to keep in the chart. Keeping the Transports will enable the reader to easily see where the handoffs occur in the process. Keeping Inspections will show where control points occur in the process. Keeping Handles and Delays can highlight areas of potential improvement in the speed of a process. Leaving just the Origination and Add/Alter symbols in the chart provides a focus on value-added that is useful from a system development standpoint. This can also be useful in a standardization project. When you have separate facilities doing nearly the same work, differences in staff size and layout will likely not be conducive to identical processes, but when you "back off" to look at items and value-added, the processes can be very close -- and major differences will stand out.

If the improved process includes a significant reduction in one type of symbol, before and after charts with just that symbol can make a dramatic visual statement in a presentation.

The Overview Chart Selection window lets you select the symbols you want to keep in the Overview Chart and also provides an option to compress the chart horizontally.

Overview process map object selector

This Overview Chart shows only the Transport steps and has been compressed horizontally.

Overview process map

Questions or Comments - Call 800-628-9558 or send us a note
About The Ben Graham Corporation | Contact Us | Permissions Work Smarter not Harder with Work Simplification
The Ben Graham Corporation. All rights reserved.